The graph
A complex story!
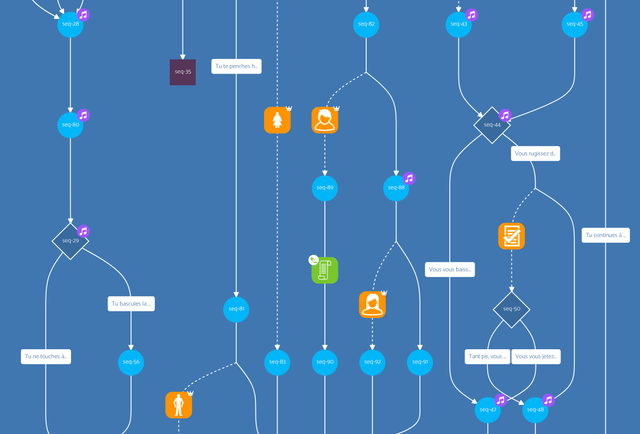
The graph represents a simplified view of your story and its branches.
The reading of this graph is done from top to bottom. Each type of sequence is represented by a node containing the sequence identifier, and a specific shape:
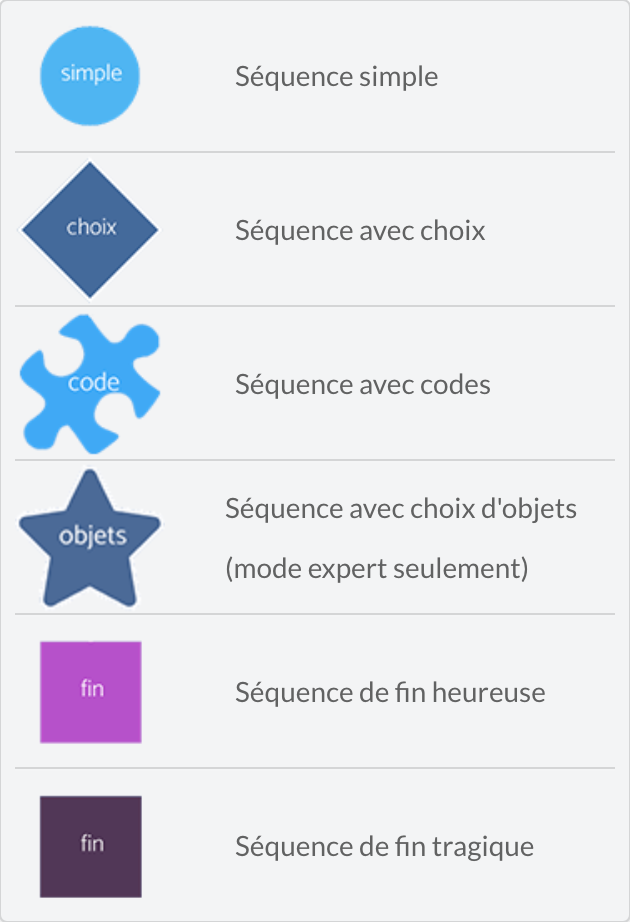
Types of sequences
The sequences are linked together with simple arrows. These links may contain additional information:
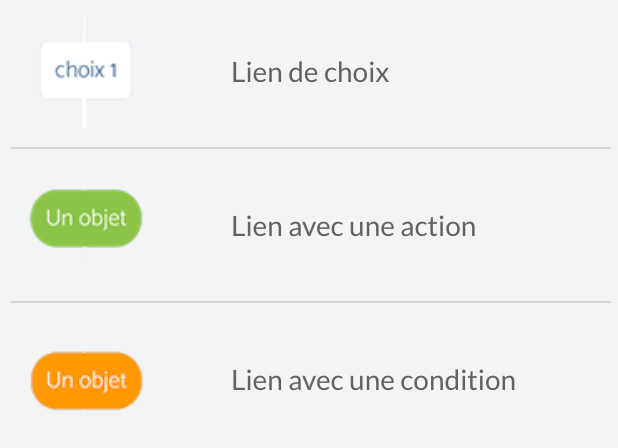
Types of links
The nodes are clickable and allow you to select the corresponding sequence. On hover, an excerpt of the sequence text is displayed in a tooltip.
Navigating the graph
From the menu at the bottom right, you can use the and buttons to change the zoom level of the graph.
An additional button allows you to change the mode of interaction with the graph. The tool , selected by default, adjusts the graph size to fit within the width of the window. By clicking on it, the button becomes . In this mode, more suitable for tablets, you can naturally zoom and move the graph.
Multi-selection
On the graph, you can hold down the left click and move the cursor to draw a selection rectangle. All nodes inside this rectangle will be selected. You can modify your selection by holding down the Shift key and clicking on the nodes to add or remove.
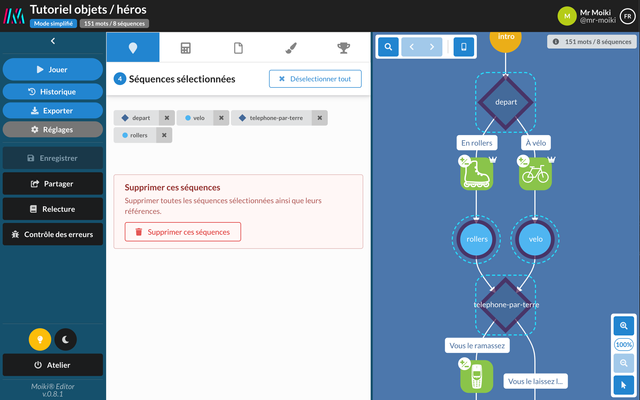
Example of multi-selection.
If you are in expert mode you will also have the option to transform the selected sequences into a routine (if constraints are met).
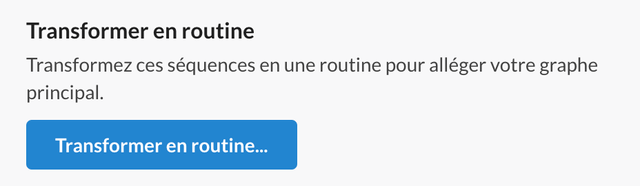
Routine transformation option.